2023 Stockspot ETF Report
Stay ahead of the investing curve with exchange traded funds (ETFs)
Since 2014, Stockspot has been researching and analysing ETFs.
In Australia, ETFs continue to rise in popularity. Our latest ETF report compares more than 250 ASX- and Cboe Australia-listed ETFs, analysing the latest and behaviours of Australian ETF investors.

Discover the best ETFs in Australia and all the latest trends
Thanks! The 2023 Stockspot ETF Report will be emailed to you in the next few minutes.

Australian ETFs: Key trends in the latest report
The 2023 Stockspot ETF Report reveals:
- The best and worst-performing ETFs
- Why 2023 was another strong year of growth for ETFs
- How much money Australians made in ETFs
- The ETFs with the most growth in assets under management
- Which ETFs are currently popular with investors
How to choose the best ETFs
Once you know the best short-term performing ETFs, you should invest as soon as possible…right?
Wrong.
Buying only the best-performing ETFs isn't a sound investment strategy. As this report shows, last year's winners often become this year's losers.
For investing success, you need diverse assets that counterbalance each other. A well-constructed portfolio of ETFs that consists of growth and defensive ETFs will help you ride the ups and downs of the market.
Stockspot is Australia's first and largest online investment adviser. Our speciality is ETFs.
We build you a custom investment portfolio of carefully selected ETFs. You get a range of different investments - with very low fees. And, unlike some other platforms, you directly own your ETFs. We don't receive commissions from any of the ETFs we recommend.
Invest in ETFs with Stockspot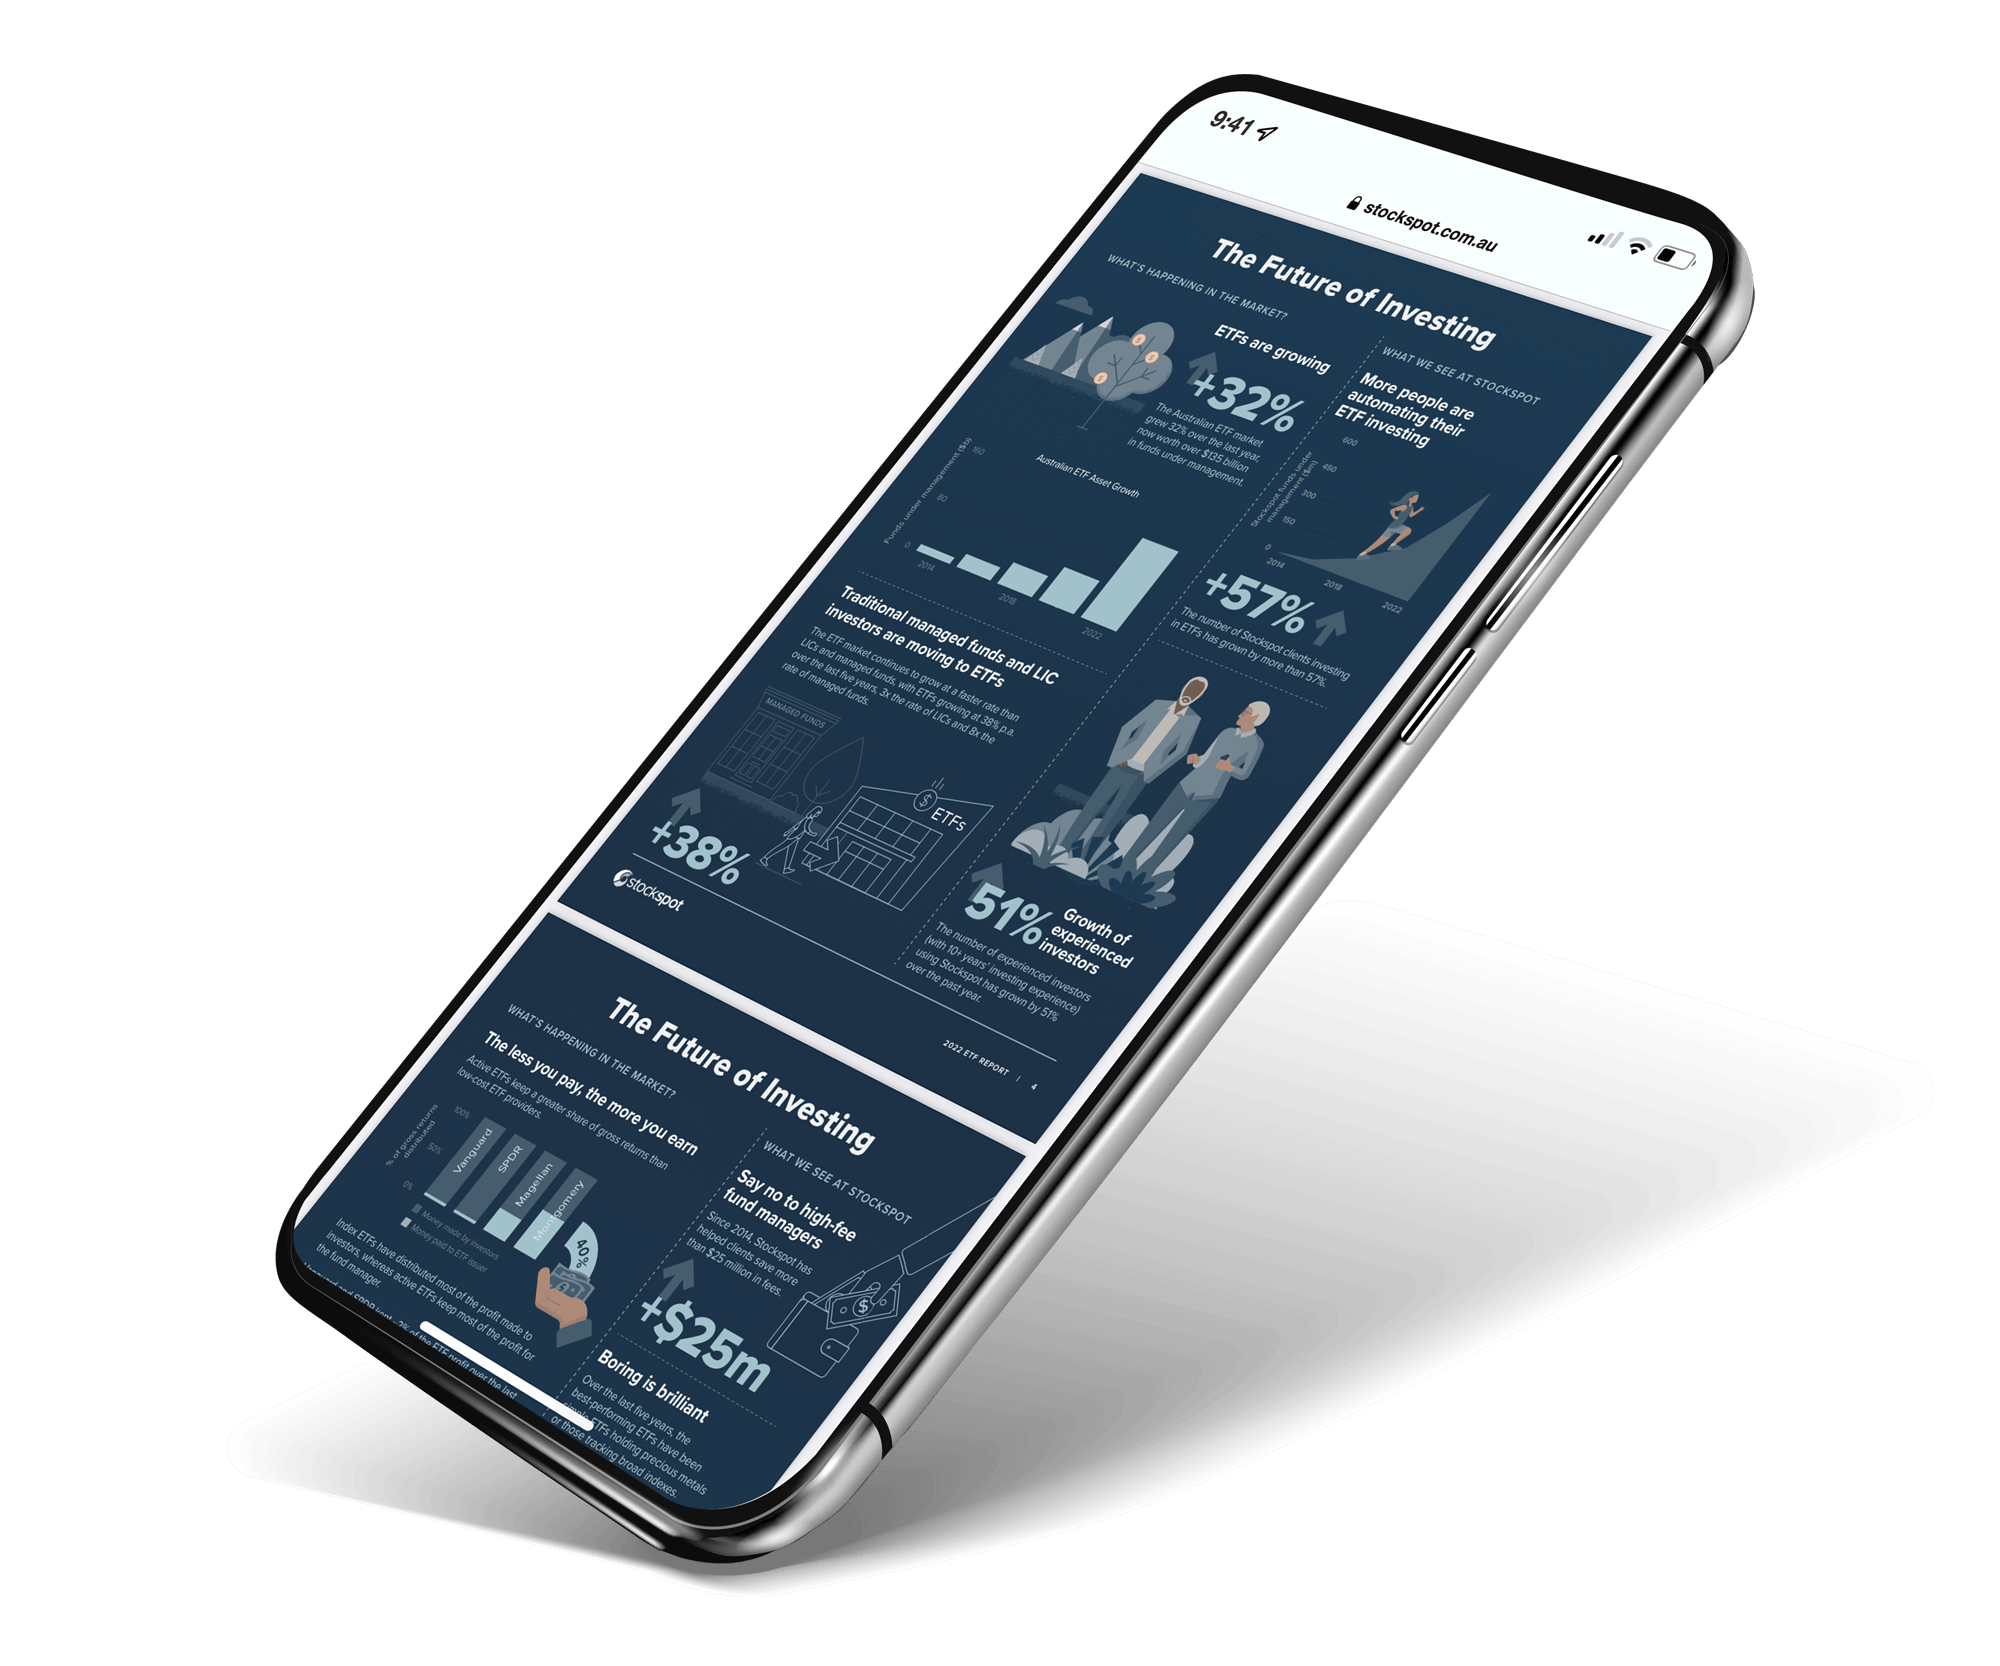
ETF Info Hub


Previous ETF Research Reports
We've been researching ETFs in Australia since 2014. If you want to find out how ETFs have performed in previous years, take a look at our archived reports.
Find out more about ETFs in Australia
What are ETFs?
Still trying to figure out what ETFs are? We explain everything you need to know in this easy to understand guide.
Read the guideCompare ETFs
We compare over 200 ETFs listed on the ASX, including fees, performance, and funds under management.
Find out moreOur chosen ETFs
We've spent a lot of time selecting the right ETFs for our portfolios. See why we've picked these ones.
Stockspot ETFs